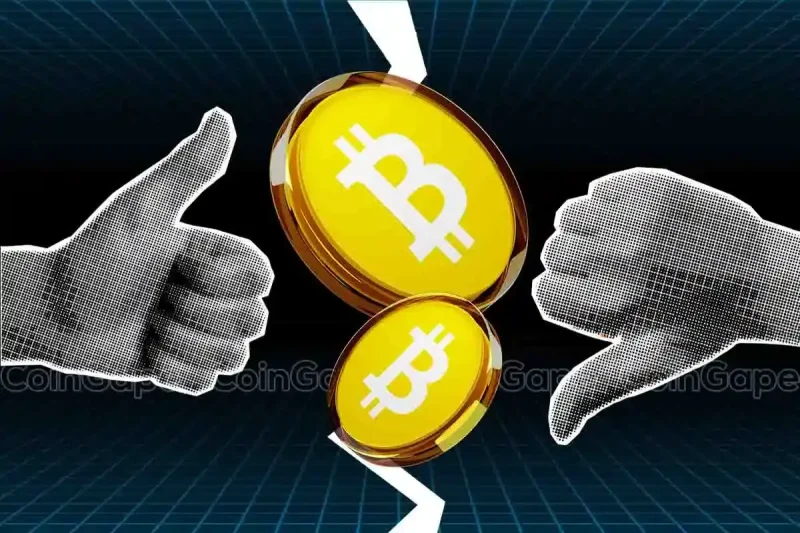
XRP Burn Rate Plunges 62% Amid Trump Tariffs on Canada and Mexico: Bullish or Bearish?

XRP price plunged toward $2 as Trump’s tariffs rattled markets, while declining network activity and bearish indicators signal further downside risks.
Ripple price down 25% in 5 days as Trump tariffs hint at further downside
Ripple (XRP) has come under intense selling pressure over the past week, with bearish catalysts compounding market uncertainty.
The first wave of downside pressure came after Bybit’s $1.4 billion exploit triggered mass liquidations.
Now, a second wave has emerged following former U.S. President Donald Trump’s confirmation of new tariffs on Canada and Mexico, set to take effect on March 1.

The tariffs, aimed at addressing trade imbalances, have sent shockwaves through global financial markets, impacting risk assets like cryptocurrencies.
Ripple price has felt the full force of this bearish sentiment.
After initially finding support near $2.40, it continued its downward spiral, dipping as low as $2.01 on Tuesday.
This brings XRP’s total losses over the past five days to approximately 25%, significantly underperforming other major digital assets.
The tariffs, combined with ongoing macroeconomic uncertainty, could exacerbate XRP’s volatility as investors seek stability in less risky assets.
Declining Burn Rate Signals More Downside Risks Ahead
Trump’s tariff policy is expected to provoke retaliatory measures from Canada and Mexico, adding further strain to an already fragile economic outlook.
This comes at a time when U.S. inflation remains a pressing concern, with the Consumer Price Index (CPI) data from February 13 showing signs of overheating.
The combination of trade policy uncertainty and persistent inflation could lead investors to adopt a more defensive stance, pulling capital away from risk assets like XRP.
On-chain data suggests XRP’s market activity is already reflecting this shift. CryptoQuant data indicates a sharp decline in XRP’s burn rate, a key metric that tracks the number of XRP tokens permanently removed from circulation through network transactions.

This decline suggests a slowdown in transactional activity on the XRP Ledger, potentially pointing to waning demand.
On February 3, the daily burn rate stood at 8,273 XRP tokens. By February 22, this figure had dropped to just 3,087 XRP, representing a 62% decline in on-chain activity. A sustained drop in the burn rate typically signals reduced network usage, which, in turn, can lead to lower trading volumes and weaker price support.
With inflationary concerns mounting and geopolitical tensions rising, further declines in network activity could create additional headwinds.
A continued slowdown in transactional volume would likely translate to softer demand, making XRP more vulnerable to downward price movements in the coming sessions.
As traders assess the macroeconomic landscape, XRP’s trajectory will likely depend on whether the asset can find meaningful support amid market-wide uncertainty.
XRP Price Forecast: Losing $2 Support Could Accelerate Bearish Momentum
XRP price remains under pressure, extending its losing streak with a 24.93% drop over the past five trading sessions.
The latest daily close at $2.1986 positions XRP dangerously close to the psychological $2 support level, with bearish indicators suggesting further downside risks.
Bollinger Bands show XRP trading near the lower band at $2.2012, indicating heightened volatility and a bearish bias.
The upper resistance at $2.8467 remains distant, reinforcing the market’s current downside momentum.

A breakdown below $2 could see price acceleration toward the next liquidity pocket near $1.80.
However, a mean-reversion bounce could be triggered if it reclaims the middle band near $2.52.
Volume Delta reflects significant sell-side pressure, with a net outflow of -30.36M, signaling weak demand absorption.
The Relative Strength Index (RSI) at 33.41 is approaching oversold conditions, suggesting potential exhaustion of selling pressure.
If RSI stabilizes and crosses 40, bulls could attempt a relief rally.
However, failure to defend $2 could amplify liquidation-driven selling, intensifying bearish momentum toward sub-$1.80 levels.
The post XRP Burn Rate Plunges 62% Amid Trump Tariffs on Canada and Mexico: Bullish or Bearish? appeared first on CoinGape.