Which election predictors deserve your trust — and which probably don’t
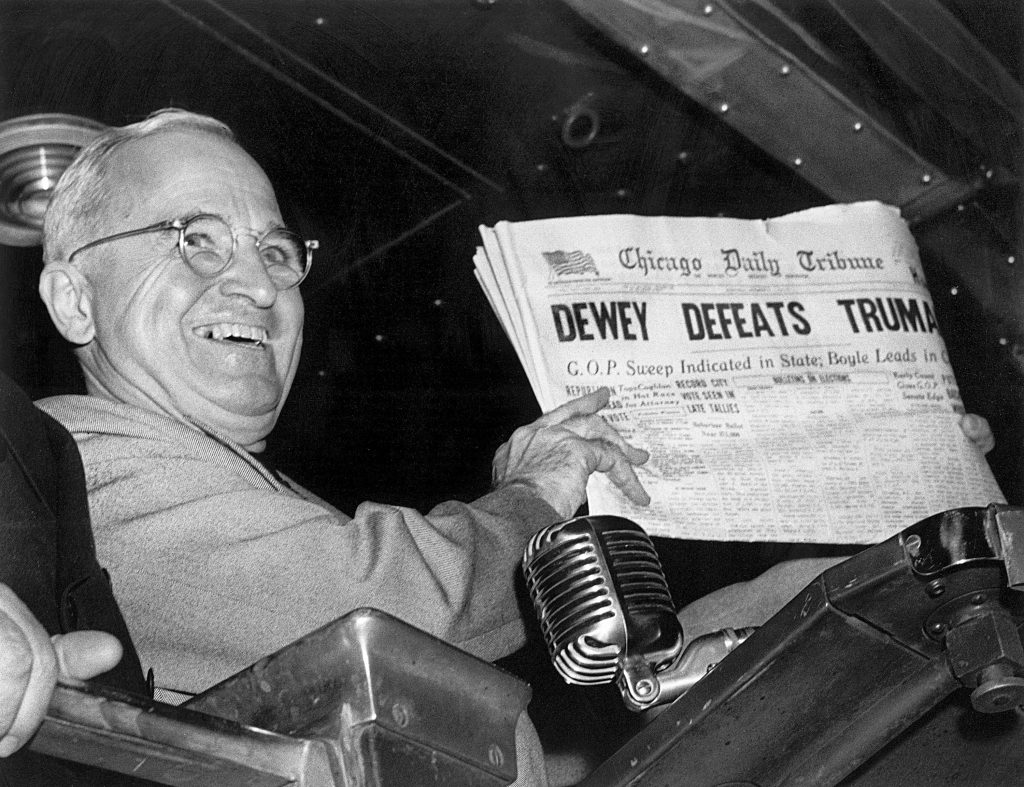
FILE - In this Nov. 4, 1948, file photo, President Harry S. Truman at St. Louis' Union Station holds up an election day edition of the Chicago Daily Tribune, which - based on early results - mistakenly announced "Dewey Defeats Truman." (AP Photo/Byron Rollins, File)
One of the more consistent criticisms of the news media over the past decade or two has been that it is overly reliant on coverage of the “horse race” — that is, a focus on who is likely to win an election rather than stories about the actual candidates and their positions.
At times, that criticism is fair. New polling data provides new information about a campaign that triggers a response from the news industry that consistent rhetoric from candidates doesn’t. The repetition of the word “new” in the preceding sentence is not an accident, of course. It’s also often the case that news outlets have covered candidates and their positions but, since those positions don’t generally change much, those stories are displaced by the newer developments.
But there’s another reason that news outlets cover developments in who’s likely to win: Readers and viewers are often very interested in the answer to that question! There is demand for analyses of the state of the race and its trajectory, quite understandably. That’s more true of races seen as more important, like the contest for the White House.
With that admittedly defensive context established, we can now turn our attention to the point of this article: differentiating between assessments of the likely outcome of the race that are useful and those that are garbage. Both exist! None is perfect! And some predictors that are garbage or garbage-approximate might end up close to the mark simply by virtue of the broken-clock truism. If you want to understand what might happen next month, though, it’s useful to know where to look.
Without further ado, here is an assessment of some of those predictive vehicles, arranged from least to most sophisticated.
Social media surveys
These fall into the category of “garbage.”
To be clear, we’re talking here about polls conducted on platforms such as X (né Twitter). Random user @PartisanDude2 asks his 200,000 followers if they plan to vote for Vice President Kamala Harris or former president Donald Trump, and 85 percent of those users — who followed him because they like his pro-Harris commentary — say they plan to vote for the vice president. This doesn’t tell us much.
It’s important to highlight a precise reason this doesn’t tell us much: because the respondents can self-select. There are lots of other reasons, too, like that bot accounts can weigh in, as can foreign users, and like that there’s no reason to think that any respondents are registered to vote or plan to cast a ballot. This issue of people being able to choose to participate, though, is worth remembering.
Because the next predictive vehicle is …
Betting markets
Betting markets, sites where people can invest in the likelihood of a particular electoral outcome, are relatively new and exist in a murky and evolving legal landscape. The theory, though, is uncomplicated: Let people put money on how they expect an election to unfold, and the wisdom of the market will produce predictive results.
These markets don’t have a lengthy track record in the United States that allows us to determine just how often that theory might be borne out. You can probably see one problem immediately, though, which is that the markets are going to overweight the beliefs of people with the time and personality to spend money betting on campaigns.
And then there’s the problem of self-selection. One X user noted this week, for example, that the 2024 presidential-contest betting on the site Polymarket was being swayed by one pro-Trump bettor with very deep pockets. That person might simply believe fervently in Trump’s chances, certainly, making his or her purchase of shares in Trump’s victory seem like a wise investment. But that belief is shifting the odds for everyone else.
Past predictors
Another way in which people attempt to predict the outcome of the election is to look at certain indicators that correlate to past results, like presidential approval ratings and shifts in the economy. The most famous purveyor of this approach is American University professor Allan Lichtman, who generates media attention every four years with his assessments of what the indicators he looks at say about the upcoming race.
So how has he done? Well, Lichtman predicted that Joe Biden would win in 2020, which he did, and that Trump would win four years before that … which he did, despite losing the popular vote. In 2000, Lichtman predicted that Al Gore would win, his sole “wrong” prediction since 1984 — except that Gore won the popular vote, too. In national races where the popular-vote margin was 3 percentage points or less, in other words, Lichtman is 2 for 3, depending on whether you want to say he got 2000 or 2016 wrong.
This year, he says Harris will emerge victorious.
Statistically weighted polls
We have, at last, arrived at attempts to actually measure support among American voters.
Before we get too far, though, let’s dispel some myths. No, pollsters don’t only speak to people with landlines. (For years, pollsters have called cellphones and, these days, reach people by text message, with — controlled, limit — online questionnaires and using ongoing panels.) No, polling isn’t irretrievably broken as demonstrated by misses in 2016 swing-state polling. (2018 and 2022 polling was very accurate, for example.) No, talking to respondents who aren’t perfectly representative of the voting population doesn’t mean that results are necessarily wrong. (Pollsters use mathematical weighting to compensate for differences between who they are talking to and the target population.)
This isn’t to say that polling is perfect, of course. For one thing, election polls are dependent on predictions about who will vote; get that wrong and your poll’s in trouble. But no one is more interested in getting polling right than the pollsters whose reputations and livelihood depend on their being accurate.
The business model for betting markets is making money on betting. If they get the results right, great. The business model for pollsters is providing accurate assessments of opinion.
Most pollsters. There are polling firms that work for candidates or that seem to have found a niche in providing partisan media outlets with talking points. 538’s Nathaniel Rakich recently wrote a guide to reading political polls that addresses this and other useful considerations. It’s worth a look.
Election polls also tend to jump around a lot, particularly in a close race. As we’ve noted before, these polls are not meant nor designed to be able to tell you which of two equally-supported candidates is going to win. There are various considerations — again, well-known to pollsters! — that can affect results. There’s the margin of (sampling) error, a statistical calculation of how much uncertainty applies to the poll. There is that question about the electorate. There’s a big difference in the margin of error between a poll of 100 people and a poll of 600 people — but not much difference between a poll of 600 people and a poll of 1,100 people.
Math can get weird, so it’s worth remembering that a 49 percent to 47 percent poll is almost always best read as “tied.” Not very satisfying, but accurate.
Polling averages
One way to accommodate those mathematical fluctuations is with an average of polls. For this part, let’s use an example.
Imagine a race between candidates from two parties, the Circles and the Squares. Over the last 100 days of the election, both parties have their conventions and both campaigns are rocked by scandals. The actual support each candidate has — that is, the support each candidate would see if the election were that day — goes up and down in a range from 45 percent to 50 percent, as below.
This data is fake, mind you, generated solely for illustrative purposes. For the same reason, we also generated polling of the race from four different pollsters, each with different margins of error (from 4 to 6 percent), different polling frequencies and different “house effects” — tendencies of different pollsters to advantage one party or the other.
Below we show how those four firms “polled” the race. (To generate these, we shifted the “real” value of support for a given day based on randomized consideration of house effects and margins of error.) Firm A had a low margin of error (MOE) and low house effect. B had a high MOE and low house effect. C had a higher MOE and modest house effect, while D had a low MOE and big house effect. We assumed each poll lasted three days; the release date of the poll (the day after it was completed) is shown.
All over the place! With 50 days until the election, for example, at a point when the “real” support had the Circle Party with a 1-point lead, the most recent polls from the four pollsters showed Square plus-2, Circle plus-6, Circle plus-3 and Circle plus-6. Hard to know what to think!
One issue is that those polls were taken at different times. Another is that the race changed in the days before the 50-day mark, as our “real” data shows. Polls wouldn’t yet have captured the shift.
If we look at the average of the four polls (using a seven-day average of when polls were actually being conducted), the trends become clearer.
In fact, the average comports well with the “real” values. At the 50-day mark, Circle still has a 4-point lead in the average, but in less than a week it has the two candidates running even.
Notice that the end result, though, isn’t that accurate: the average has a 7-point Circle lead in a race that ends up being Circle plus-2. Why? In part because the race shifted in the last few days, something not captured in the polls. This is, in part, what happened in 2016: Undecided and independent voters shifted to Donald Trump in the closing days of that race.
Overall, though, the average was a better predictor of “real” sentiment over the course of the last 100 days. It was, on average, about 0.1 points away from the “real” margin between the candidates on any given day. The pollsters ranged between 0.5 points (Pollster C) and 1.7 points (Pollster D) away from the “real” values on the dates their polls were released — in part because the release dates of polls themselves are later than support is actually measured.
Again, this is just an example, done with randomized values. But the point is the same: Averages end up giving a better sense of the course of an election, albeit an imperfect one. And the more polling, the better the average tends to do.
Weighted polling averages
One way in which poll watchers and the media try to ensure more accuracy is by eliminating or de-emphasizing dubious or historically inaccurate polls. The Washington Post’s ongoing average uses only results from certain public polls. (One effect of this is that our average moves more slowly than others.) Nate Silver’s The Silver Bulletin average gives more credence to pollsters with better track records. 538 does a little of both.
There’s a lot of complicated math that undergirds this, more than was worth generating for our fake polling above. (Particularly since it was designed to be tumultuous.) That math also includes adjustments that can themselves be subjective.
How effective are the results? Well, we don’t have a huge pool of examples of applying this approach to presidential elections — Silver, the best-known of those who compile such averages, has only been doing it since 2008 — and this cycle includes several new entrants, some with new models. So … we’ll see?
Election forecasts
Of course, those national averages are also hobbled by the same asterisk that tripped up Lichtman: The president isn’t decided by the national vote. So Silver Bulletin and 538 and others do election forecasts, running hundreds of iterations of the election with state-level results determined by consideration of state-level polling averages (which are themselves often dependent on national polling) and occasional other factors like economic data.
Right now, 538 suggests that Harris would win 53 times if the election were run 100 times as polls stand at the moment. This doesn’t mean she has a 6-point lead, given that Trump wins 47 times out of 100. A 6-point lead is a big lead. A 53-times-to-47-times advantage is a narrow advantage, if you can say it’s much of an advantage at all.
If I said that 53 percent of the judges in a baking competition thought you had the better pie — a measure of support equivalent to a polling average — you’d be pretty excited about your odds. If I said that you had a 53-in-100 chance of being brained by a meteor as you went to receive your trophy — analogous to the forecast — you’d be pretty unhappy about your imminent victory.
After the 2016 election, 538 (then under Silver’s direction) received a lot of criticism for suggesting that Hillary Clinton was likely to win. But the site gave Trump a 3-in-10 chance of winning — hardly a prediction that such an outcome was impossible.
The current forecasts are probably the most useful predictor of what will happen, precisely because they demonstrate so much uncertainty about the outcome. Unlike Lichtman or the anonymous investors in betting markets, forecasts based on polling averages suggest that the race is (and has long been) a toss-up.
Might as well add that to our list, in fact:
Tossing a coin
This is admittedly not the most sophisticated means of determining who will win. But it remains the approach that best captures the state of the race.