Veteran Trader Peter Brandt Calls Ethereum “A Moon Shot”


Veteran trader Peter Brandt has identified a chart pattern in Ethereum price that he believes may lead to a major price move. Known for his critical views on Ethereum, Brandt stated that the current congestion pattern on the ETH monthly chart could support what he called a “moon shot.”
Brandt shared the analysis on his social media, noting that ETH has been trading within a long-term symmetrical triangle pattern since 2021. This formation often appears during market consolidation and can lead to a strong price breakout if confirmed.
Ethereum Price Structure Suggests Breakout to $6000
According to Peter Brandt’s chart, Ethereum price has formed a large symmetrical triangle pattern on the monthly timeframe. This pattern is made of lower highs and higher lows, compressing ETH’s price into a narrowing range. The upper boundary connects the highs from 2021 and 2024, while the lower boundary has formed from the 2022 bottom and recent 2025 lows.
Brandt pointed out that this pattern could be the base for a large upward move. “This congestion pattern could support a moon shot,” he stated. He also mentioned that he generally avoids commenting positively on Ethereum price but sees technical strength in the current chart structure.
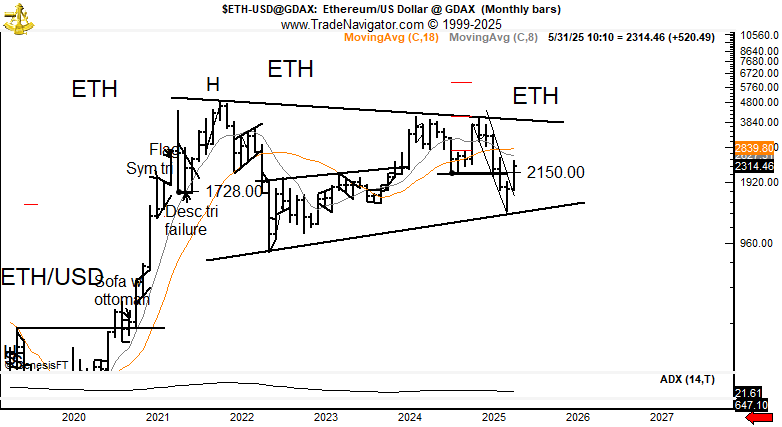
The ETH price bounced from the lower support of the triangle around $1,728 and $2,150 and closed the May 2025 bar at $2,314.46, with a monthly gain of $520.49. Brandt added that if Ethereum price breaks above the triangle resistance around $2,850–$2,900, the price could reach between $5,600 and $6,000.
ETH Price Pattern Matches 2020 Breakout Structure
Some analysts, such as Trader Tardigrade, have pointed out a repeating pattern from 2020. ETH formed a similar ascending triangle in 2020, followed by a strong rally from below $150 to above $400 in a few months. The current 2025 chart mirrors that setup, with a horizontal resistance level and rising support trendline.
The breakout in 2025 has been marked by a strong bullish candle and an implied rise in buying volume, adding credibility to the move. Ethereum price is currently forming a parabolic support curve under its price, similar to the 2020 structure that led to a multi-month rally.
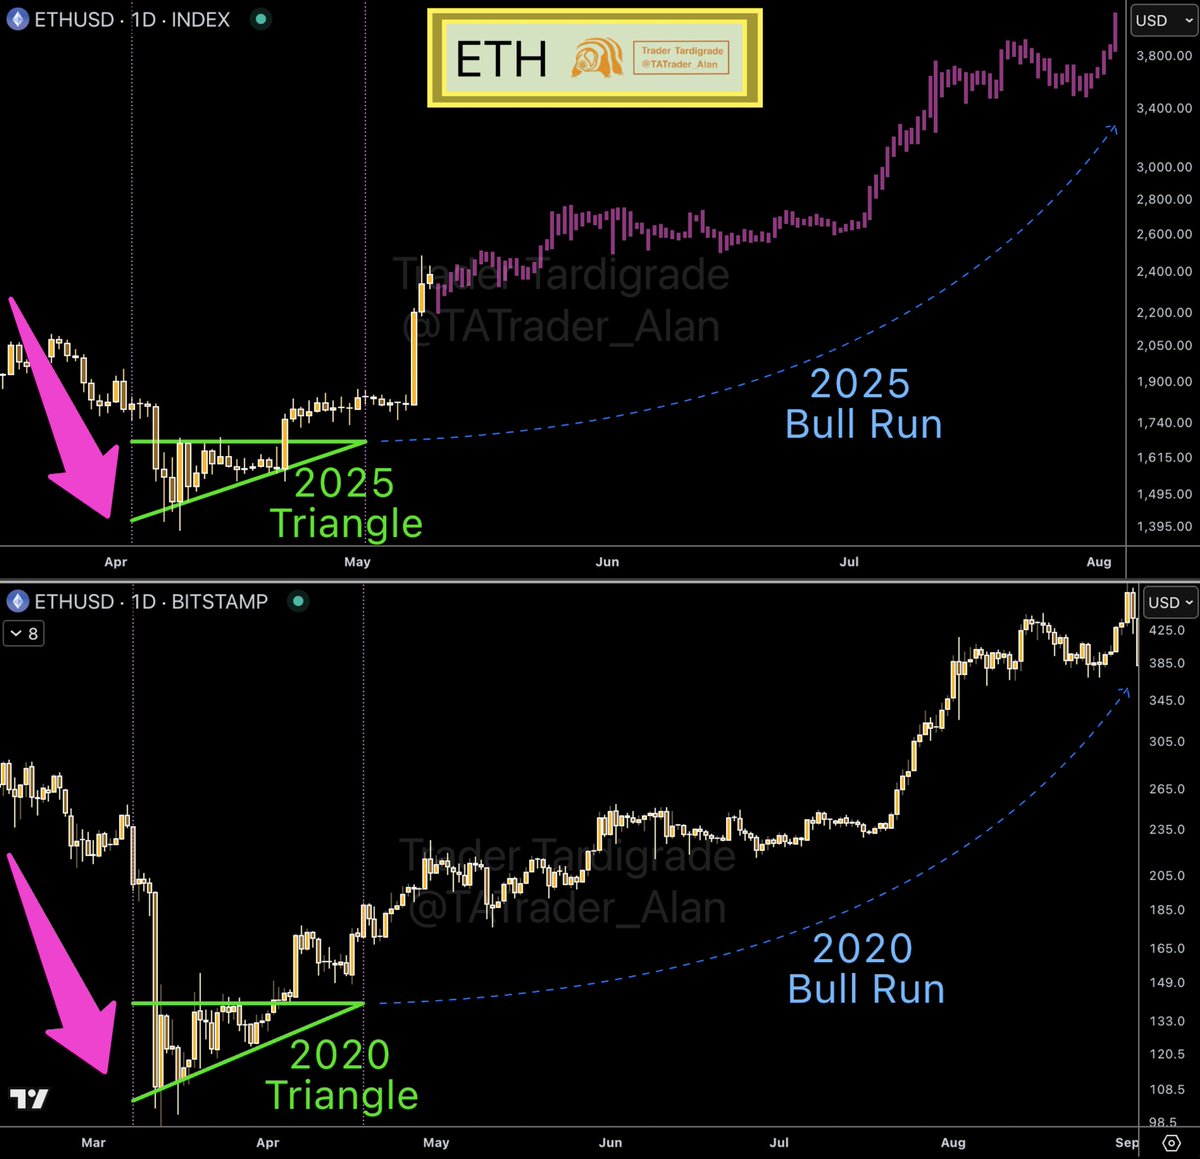
According to the projection path from the triangle’s height, ETH could move toward $3,800 and beyond if the current breakout holds. Moreover, Institutional developments are also contributing to growing interest in Ethereum. This week, BlackRock filed for an Ethereum ETF with staking capabilities after the ETH upgrade, fuelling hopes of hitting a new ATH.
Whale Activity Add to Interest
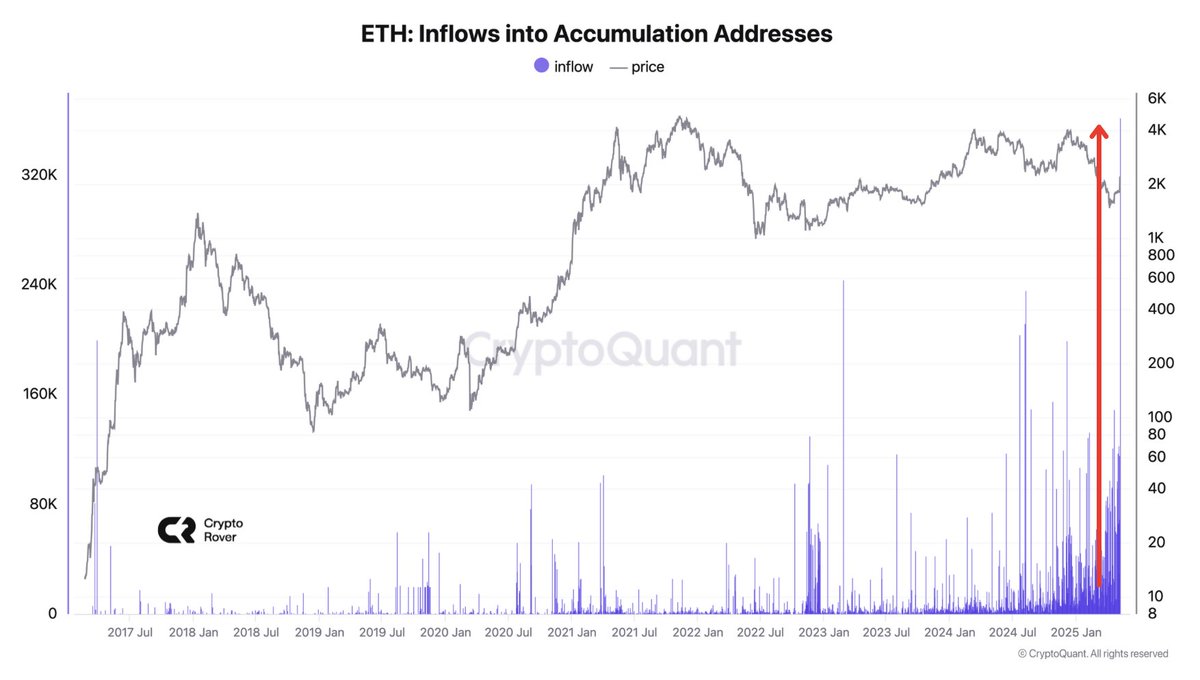
While ETH continues its upward movement, on-chain data shows that accumulation wallets are receiving record inflows. A large blue bar on the chart signals the highest single-period inflow into accumulation wallets in ETH’s history since 2017. Despite this, the current Ethereum price is still 47% below its all-time high of $4,891 set in November 2021.
Recent whale activity has also attracted attention. A wallet linked to the Ethereum ICO has sold thousands of ETH in recent weeks. The ICO participant originally bought 76,000 ETH at $0.31 each and has been steadily liquidating holdings, including 1,900 ETH sold on Kraken for $4.44 million.
In addition, Brazil’s B3 exchange has announced that it will list ETH and SOL futures in mid-June, expanding crypto derivatives trading in Latin America. This move comes as the market sees higher stablecoin supplies and improved investor sentiment due to expectations of U.S. interest rate cuts.
The post Veteran Trader Peter Brandt Calls Ethereum “A Moon Shot” appeared first on CoinGape.