S&P 500 Drops Quickly to Test Key Support Amid Rising Volatility
Thank You!
I’ve been writing at StockCharts.com for nearly 20 years now and many of you have supported my company, EarningsBeats.com, and I certainly want to show my appreciation for all of your loyalty. I believe we’re at a major crossroads in the stock market as the S&P 500 tests the recent price low from earlier in March. I called for a 2025 correction at our MarketVision 2025 event on January 4, 2025, to start the year and now it’s a reality. We decided at that time to add quarterly updates to our MarketVision series and our first update (Q1 update) is being held today at 5:30pm ET. I would like to invite everyone to join EarningsBeats.com and join me later today. We will record the event for those who cannot attend live.
Even if you decide not to join as an EB.com member, I do want to provide you my latest Weekly Market Report that we send out to our members at the start of every week, in addition to our Daily Market Report, which is published Tuesdays through Fridays.
I hope you enjoy!
MarketVision 2025 Q1 Update
Join us for our MarketVision 2025 Q1 update at 5:30pm ET today. This is an exclusive event for our annual members. If you’re already an annual member, room instructions will be sent to you in a separate email.
Not yet an annual member? Save $200 on membership TODAY ONLY. This offer will expire at the start of today’s event, so CLICK HERE for more information and details!
If you recall, on Saturday, January 4, 2025, I provided my annual forecast, which included my belief that we’d see a 10% on the S&P 500. That 10% correction is now in the rear view mirror, but what will happen from here? A lot has changed and we must remain objective as to where we might go. I’ll provide you my latest thoughts on this during today’s event.
I hope to see you at 5:30pm ET!
ChartLists Updated
The following ChartLists were updated over the weekend:
- Strong Earnings (SECL)
- Strong Future Earnings (SFECL)
- Raised Guidance (RGCL)
These ChartLists are available to download into your StockCharts Extra or Pro account, if you have a StockCharts membership. Otherwise, we can send you an Excel file with the stocks included in these ChartLists in order to download them into other platforms. If you have any questions, please reach out to us at “support@earningsbeats.com”.
Weekly Market Recap
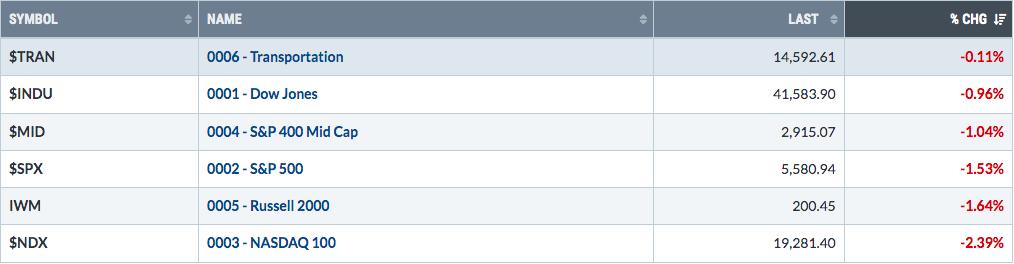
Major Indices
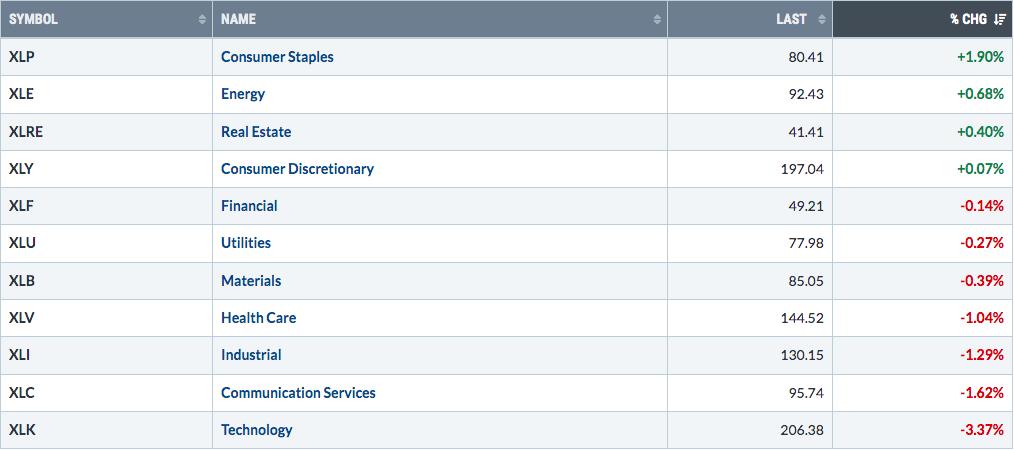
Sectors
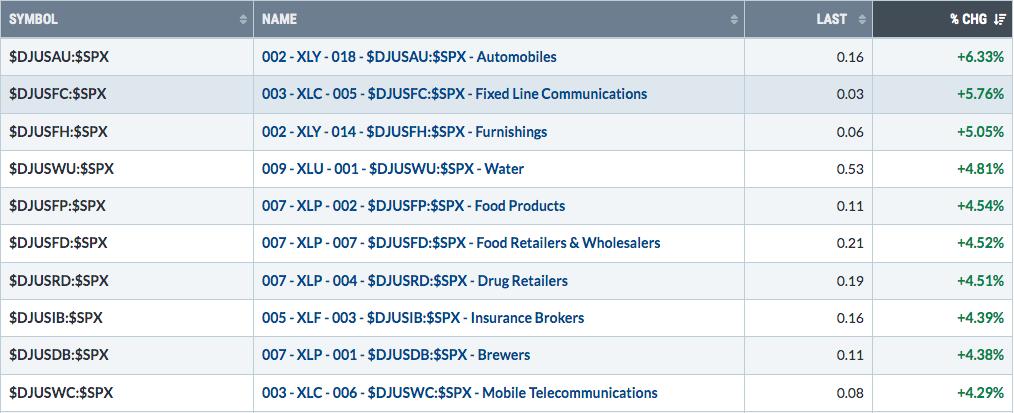
Top 10 Industries Last Week
Bottom 10 Industries Last Week

Top 10 Stocks – S&P 500/NASDAQ 100
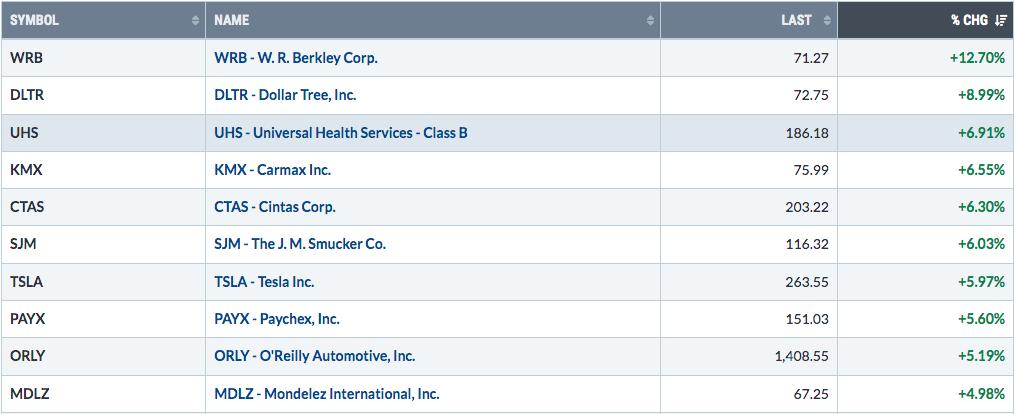
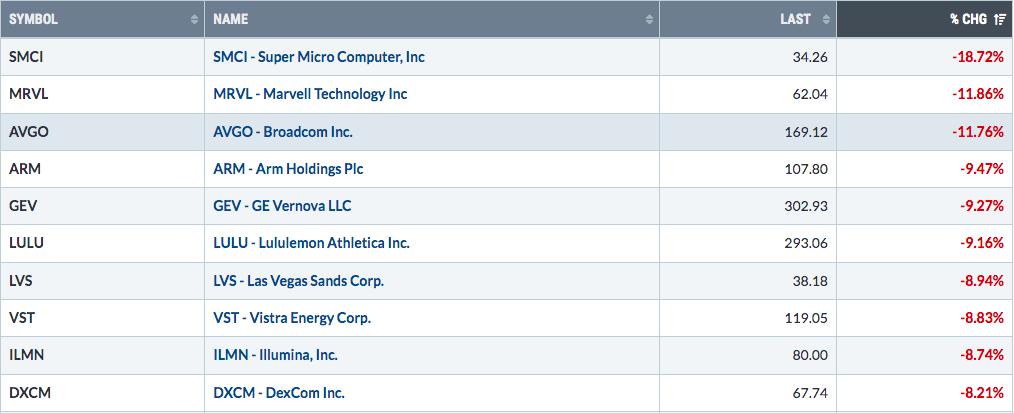
Bottom 10 Stocks – S&P 500/NASDAQ 100
Big Picture
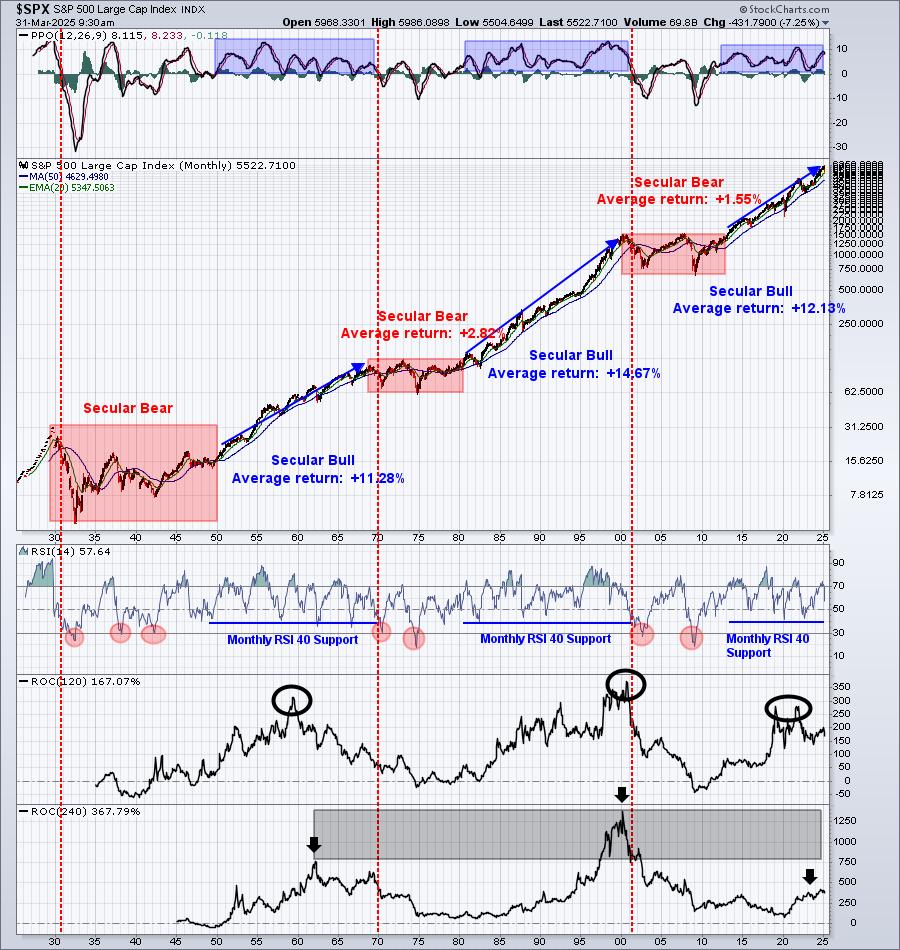
The monthly PPO and monthly RSI are both moving lower now, but remember, we have not ever seen a secular bear market that did not coincide with a negative monthly PPO and a monthly RSI below 40. I believe we’ll see this market weakness end LONG BEFORE we see either of those technical developments on the above chart.
Sustainability Ratios
Here’s the latest look at our key intraday ratios as we follow where the money is traveling on an INTRADAY basis (ignoring gaps):
QQQ:SPY
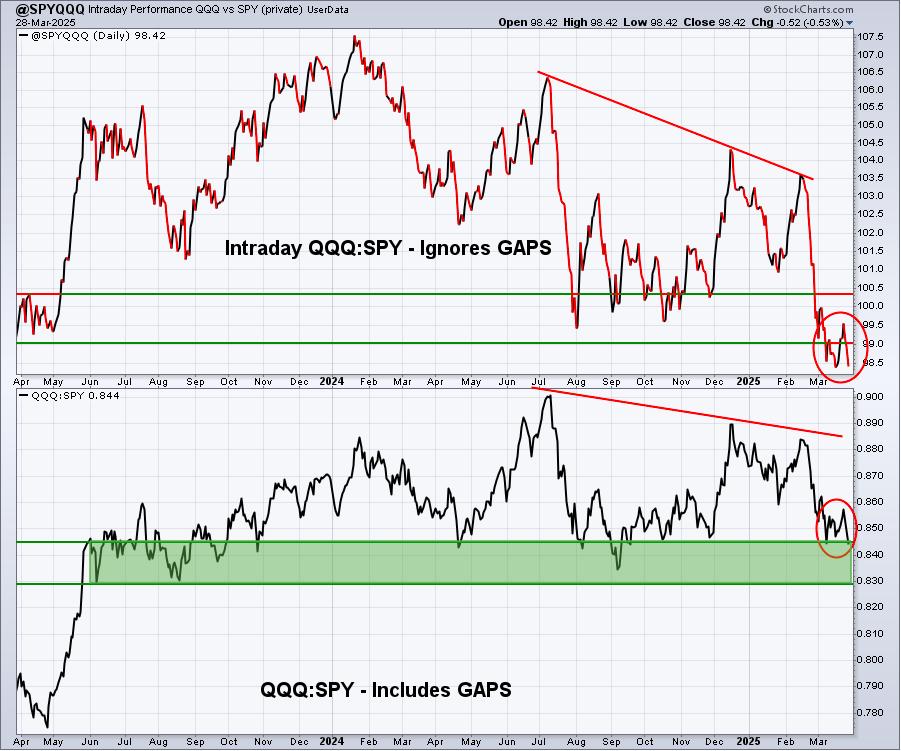
Relative weakness in the QQQ:SPY, including and excluding gaps, has turned back down in a big way. That’s not what you want to see from a bullish perspective. We must remain on guard for potential short-term downside action, especially if key closing price support at 5521 fails on the S&P 500.
IWM:QQQ
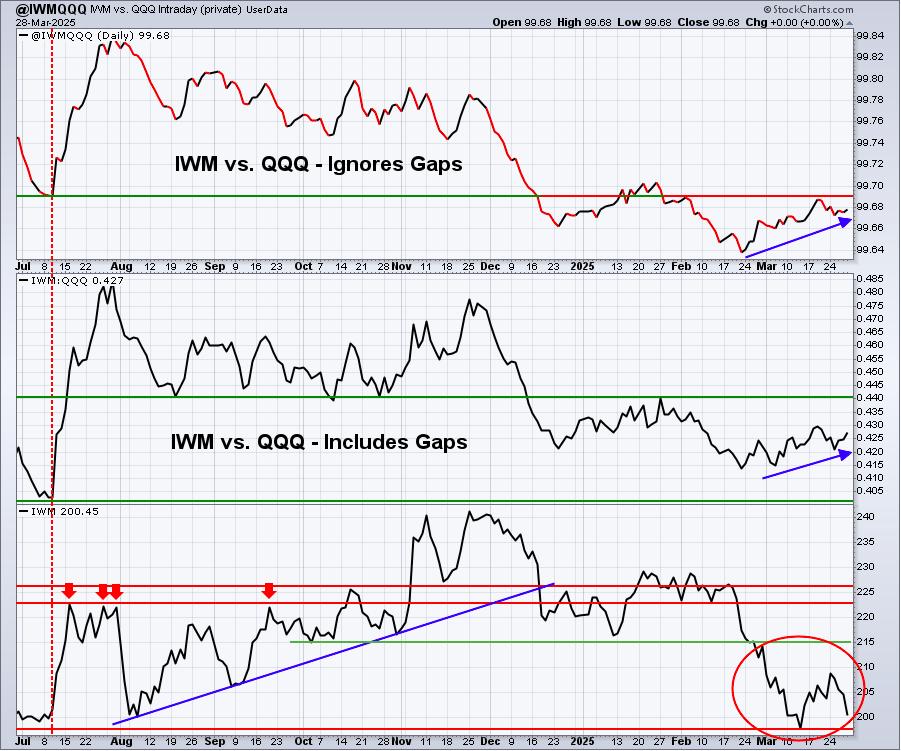
Small caps (IWM) seem to be performing better than the aggressive, Mag 7 led NASDAQ 100, but that’s not saying a lot when you look at the IWM’s absolute performance in the bottom panel. Perhaps we’ll still get the small-cap run that we’ve been looking for over the past year, but it’ll likely need to be accompanied by a much more dovish Fed and with the short-term fed funds rate falling.
XLY:XLP
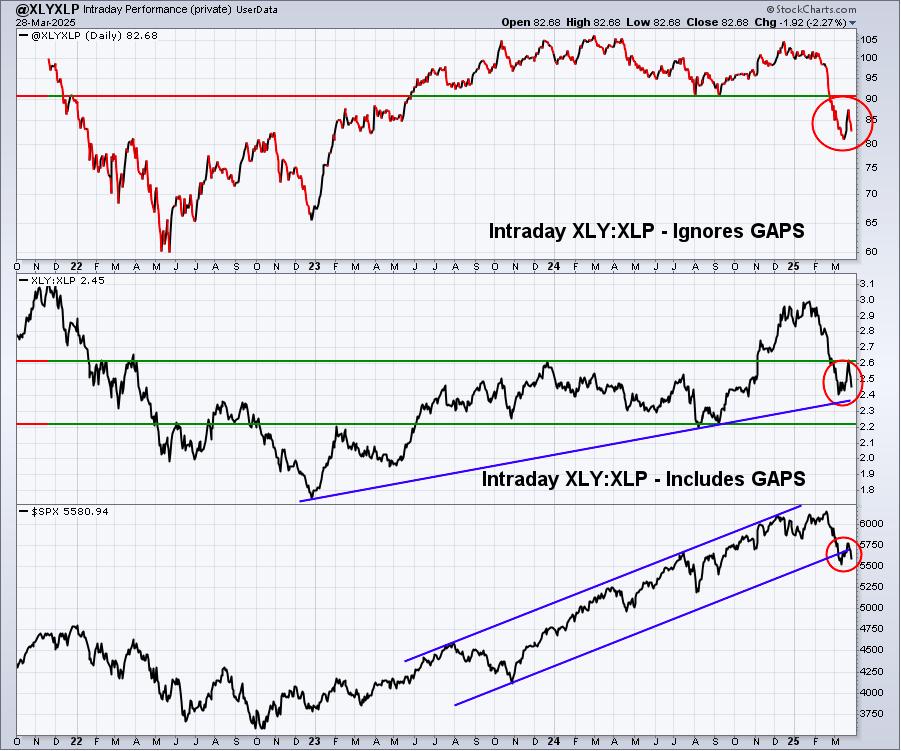
I mentioned last week that this chart was the biggest positive of the prior week. I suppose I now need to say it’s the biggest negative of last week because it did an abrupt about-face. It appears that the options expiration and oversold bounce we enjoyed for over a week have ended. We haven’t broken back to new relative lows, which would obviously be bearish, but we did back a lot of ground that we had previously made up. The XLY:XLP ratio is one of the most important in the stock market, as far as I’m concerned. Watching it turn back down is not a great feeling, and a new upcoming relative low would only make it worse.
Sentiment
5-day SMA ($CPCE)
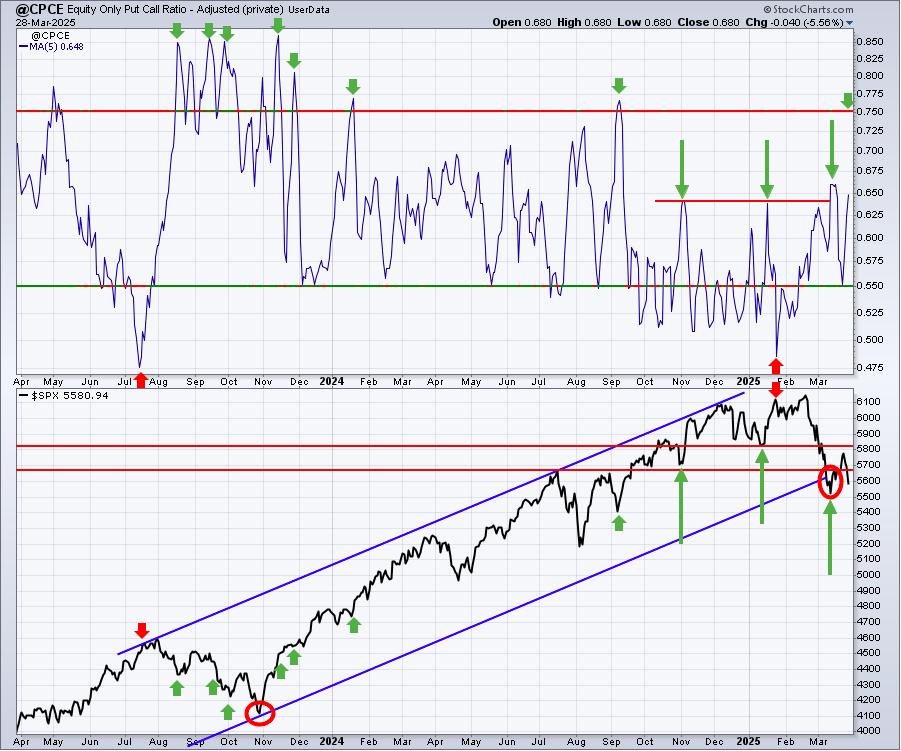
Sentiment indicators are contrarian indicators. When they show extreme bullishness, we need to be a bit cautious and when they show extreme pessimism, it could be time to become much more aggressive. Major market bottoms are carved out when pessimism is at its absolute highest level.
When an elevated Cboe Volatility Index ($VIX) sends a signal that we could see pain ahead, which is exactly the message sent recently as the VIX approached 30, I usually turn my attention to a rising 5-day SMA of the equity-only put-call ratio ($CPCE) to help identify market bottoms. Once the stock market turns emotionally and begins to show fear and panic, key price support levels tend to fail, and a high reading in the VIX, combined with a huge reversal on the S&P 500 (think capitulation), usually are typical ingredients to establish a key bottom.
We’re finally starting to see some higher daily CPCE readings, which suggests that options traders are growing much more nervous, and that’s a good thing if we’re going to try to carve out a meaningful market bottom. The last four days have seen readings of 0.65, 0.71, 0.72, and 0.68. That’s not quite high enough to grow more convinced of an impending bottom in stocks, but it’s light years better than what we’ve seen during any other recent market selloffs.
253-day SMA ($CPCE)
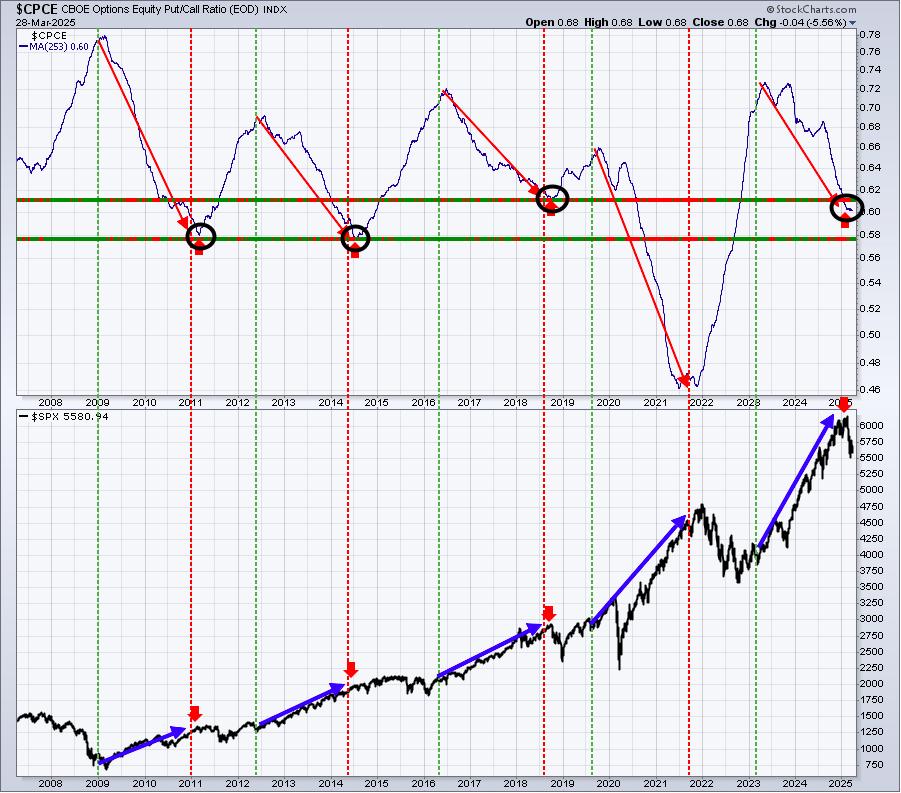
We’re coming off an extended run higher in the benchmark S&P 500, where we topped on February 19. The long-term picture with sentiment is much different than it was 1.5 to 2 years ago. Back then, everyone was bearish, leading to an important market bottom and a subsequent rally to new all-time highs. We could use more bearishness in options to set us up for another rally to all-time highs. Based on this chart, we’re not there yet.
Volatility ($VIX)
Here’s the current view of the VIX:
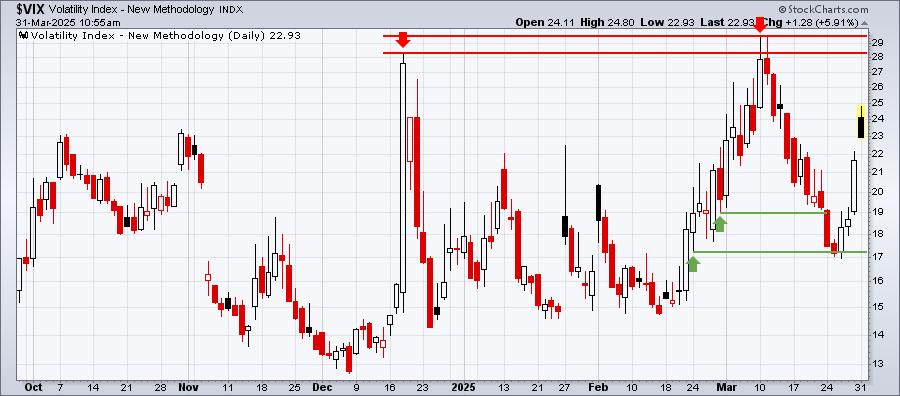
There was one key development in the VIX. From studying the VIX long-term, whenever a top has been reached, and significant selling ensues, the VIX typically spikes into the 20s or 30s before we see some sort of a rebound, like the one we saw recently. When these bounces have been part of bear market counter rallies, the VIX has never dropped below the 16-17 support range. So for those looking for this current correction to morph into a bear market, the hope is absolutely alive and kicking. My interpretation is that bear markets require a certain level of uncertainty and fear. The VIX remaining above that 16-17 level is our proof that the market environment for further selling still exists. In the above chart, the VIX fell to 17 and then quickly reversed and today hit a high of 24.80.
Based on this one signal alone, I cannot rule out further selling ahead and a possible cyclical bear market, as opposed to the much more palatable correction.
Long-Term Trade Setup
Since beginning this Weekly Market Report in September 2023, I’ve discussed the long-term trade candidates below that I really like. Generally, these stocks have excellent long-term track records, and many pay nice dividends that mostly grow every year. Only in specific cases (exceptions) would I consider a long-term entry into a stock that has a poor or limited long-term track record and/or pays no dividends. Below is a quick recap of how I viewed their long-term technical conditions as of one week ago:
- JPM – nice bounce off the recent 50-week SMA test
- BA – up more than 20% in less than 2 weeks; 190-192 likely to prove a difficult level to pierce
- FFIV – 20-week EMA test successful thus far
- MA – another with a 20-week SMA test holding
- GS – 10% bounce off its recent 50-week SMA test
- FDX – lengthy four-month decline finally tested, and held, price support near 220
- AAPL – weakness has not cleared best price support on the chart at 200 or just below
- CHRW – testing significant 95 level, where both price and 50-day SMA support reside
- JBHT – has fallen slightly beneath MAJOR support around 150
- STX – 85 support continues to hold
- HSY – did it just print a reverse right shoulder bottom on its weekly chart?
- DIS – trendless as weekly moving averages are not providing support or resistance
- MSCI – 3-year uptrend remains in play, though it’s been in a rough 6-7 week stretch
- SBUX – first critical price test at all-time high near 116 failed miserably; support resides at 85
- KRE – looking to establish short-term bottom at 55, with 2-year uptrend intact
- ED – showing strength in March for 9th time in 10 years, moving to new all-time high
- AJG – continues one of most consistent and dependable uptrends, trading just below all-time high
- NSC – testing 230 price support as transportation woes continue
- RHI – has broken recent price support in upper-50s; searching for new bottom with 4.4% dividend yield
- ADM – struggled again at 20-week EMA, 45 represents a significant test of long-term uptrend
- BG – approaching 4-year price support at 65 after failed test of declining 20-week EMA
- CVS – bottom now seems light years away as CVS trades nearly 1-year high
- IPG – how long can it hold onto multi-year price support at 26?
- HRL – still bound between price support at 27.50 and 20-week EMA resistance at 30.15
- DE – still trending above its rising 20-week EMA
Keep in mind that our Weekly Market Reports favor those who are more interested in the long-term market picture. Therefore, the list of stocks above are stocks that we believe are safer (but nothing is ever 100% safe) to own with the long-term in mind. Nearly everything else we do at EarningsBeats.com favors short-term momentum trading, so I wanted to explain what we’re doing with this list and why it’s different.
Also, please keep in mind that I’m not a Registered Investment Advisor (and neither is EarningsBeats.com nor any of its employees) and am only providing (mostly) what I believe to be solid dividend-paying stocks for the long term. Companies periodically go through adjustments, new competition, restructuring, management changes, etc. that can have detrimental long-term impacts. Neither the stock price nor the dividend is ever guaranteed. I simply point out interesting stock candidates for longer-term investors. Do your due diligence and please consult with your financial advisor before making any purchases or sales of securities.
Looking Ahead
Upcoming Earnings
Very few companies will report quarterly results until mid-April. The following list of companies is NOT a list of all companies scheduled to report quarterly earnings, however, just key reports, so please be sure to check for earnings dates of any companies that you own. Any company in BOLD represents a stock in one of our portfolios and the amount in parenthesis represents the market capitalization of each company listed:
- Monday: None
- Tuesday: None
- Wednesday: None
- Thursday: None
- Friday: None
Key Economic Reports
- Monday: March Chicago PMI
- Tuesday: March PMI manufacturing, March ISM manufacturing, February construction spending, Feb JOLTS
- Wednesday: March ADP employment report, February factory orders
- Thursday: Initial jobless claims, March ISM services
- Friday: March nonfarm payrolls, unemployment rate, average hourly earnings
Historical Data
I’m a true stock market historian. I am absolutely PASSIONATE about studying stock market history to provide us more clues about likely stock market direction and potential sectors/industries/stocks to trade. While I don’t use history as a primary indicator, I’m always very aware of it as a secondary indicator. I love it when history lines up with my technical signals, providing me with much more confidence to make particular trades.
Below you’ll find the next two weeks of historical data and tendencies across the three key indices that I follow most closely:
S&P 500 (since 1950)
- Mar 31: -7.16%
- Apr 1: +67.49%
- Apr 2: +17.08%
- Apr 3: -0.40%
- Apr 4: -17.99%
- Apr 5: +68.25%
- Apr 6: +45.38%
- Apr 7: -48.59%
- Apr 8: +62.64%
- Apr 9: +60.32%
- Apr 10: +47.37%
- Apr 11: -29.33%
- Apr 12: +63.88%
- Apr 13: -21.35%
NASDAQ (since 1971)
- Mar 31: +39.81%
- Apr 1: +83.56%
- Apr 2: +18.47%
- Apr 3: -86.48%
- Apr 4: -70.46%
- Apr 5: +112.55%
- Apr 6: +26.71%
- Apr 7: -38.23%
- Apr 8: +44.64%
- Apr 9: +60.64%
- Apr 10: +47.74%
- Apr 11: -51.08%
- Apr 12: +33.04%
- Apr 13: -0.08%
Russell 2000 (since 1987)
- Mar 31: +78.83%
- Apr 1: +27.91%
- Apr 2: +18.08%
- Apr 3: -113.26%
- Apr 4: -75.19%
- Apr 5: +101.16
- Apr 6: +51.29%
- Apr 7: -90.50%
- Apr 8: +59.63%
- Apr 9: +137.22%
- Apr 10: +5.20%
- Apr 11: -80.66%
- Apr 12: +45.00%
- Apr 13: -37.09%
The S&P 500 data dates back to 1950, while the NASDAQ and Russell 2000 information date back to 1971 and 1987, respectively.
Final Thoughts
As I mentioned last week, I’m sticking with my belief that the S&P 500 ultimate low in 2025 will mark a correction (less than 20% drop) rather than a bear market (more than 20% drop). But a bear market cannot be ruled out. Honestly, I think sentiment ($CPCE) must turn much more bearish. This morning, we had another gap down and early selling and this is beginning to take a toll on options traders as they’re now starting to grow more bearish. As an example, check out this morning’s equity-only put call ratio at Cboe.com:
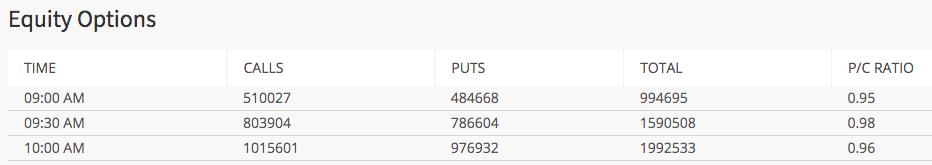
These Cboe.com readings are very high and show a definite shift in sentiment among options traders. Intense selling pressure and lots of equity puts being traded, relative to equity calls, help to mark bottoms.
Here are a few things to consider in the week ahead:
- The Rebound. It ended rather quickly last week. I mentioned it’s a rebound until it isn’t. We moved right up to 5782 price resistance on the S&P 500 and the bears took over.
- The Roll Over. We’re now in rollover mode, but the S&P 500 quickly lost 300 points from 5782 to today’s early low of 5488, which tested key short-term price support from March 13, where we printed a low close of 5521. Can the bulls hold onto support?
- Nonfarm payrolls. This report will be out on Friday morning and current expectations are for March jobs (131,000) to fall below the February number of 151,000. Also, unemployment is expected to move up slightly from 4.1% to 4.2%. Should any of these numbers come in weaker than expected, the Fed could be in a box and Wall Street could sense it by selling off hard.
- Sentiment. As I’ve said before, once the VIX moves beyond 20, not many good things happen to stocks. Selling can escalate very quickly as market makers go “on vacation.” Many times, we don’t find a bottom until retail options traders begin buying puts hand over fist. That could be underway right now.
- Rotation. Rotation led us to where we are now, we need to continue to monitor where the money is going.
- Seasonality. There is one real positive here. We’re about to move from the “2nd half of Q1”, which historically has produced annualized returns of +5.05% (4 percentage points BELOW the average annual S&P 500 return of +9%), to the “1st half of Q2”, which historically has produced annualized returns of 13.08% (4 percentage points ABOVE the average annual S&P 500 return of +9%). This half-quarter trails only the 1st and 2nd halves of Q4 in terms of half-quarter performance.
- Manipulation. Yep, it’s starting again, just like it did during 2022’s cyclical bear market, which ultimately marked a critical S&P 500 bottom. We’ve done a ton of research on intraday trading behavior on our key indices, and many market-moving stocks like the Mag 7. Our Excel spreadsheet has been made available to all ANNUAL members, where you can see the manipulation for yourself.
Happy trading!
Tom